Activity
Your app’s installation activity is the foundation of everything else - revenue, growth, customer satisfaction - it all starts here. The Activity report brings your Shopify Partner installation data into Mantle, enriching it with segmentation capabilities and putting it alongside all your other metrics where it belongs.
What makes this report different
While you can find basic installation numbers in your Partner Dashboard, Mantle’s Activity report brings everything together in one view and adds a powerful twist: segments. Want to know how Plus stores are behaving differently from your other customers? Or how that new marketing campaign affected installations in a specific region? Now you can.
Report components
Installation activity overview
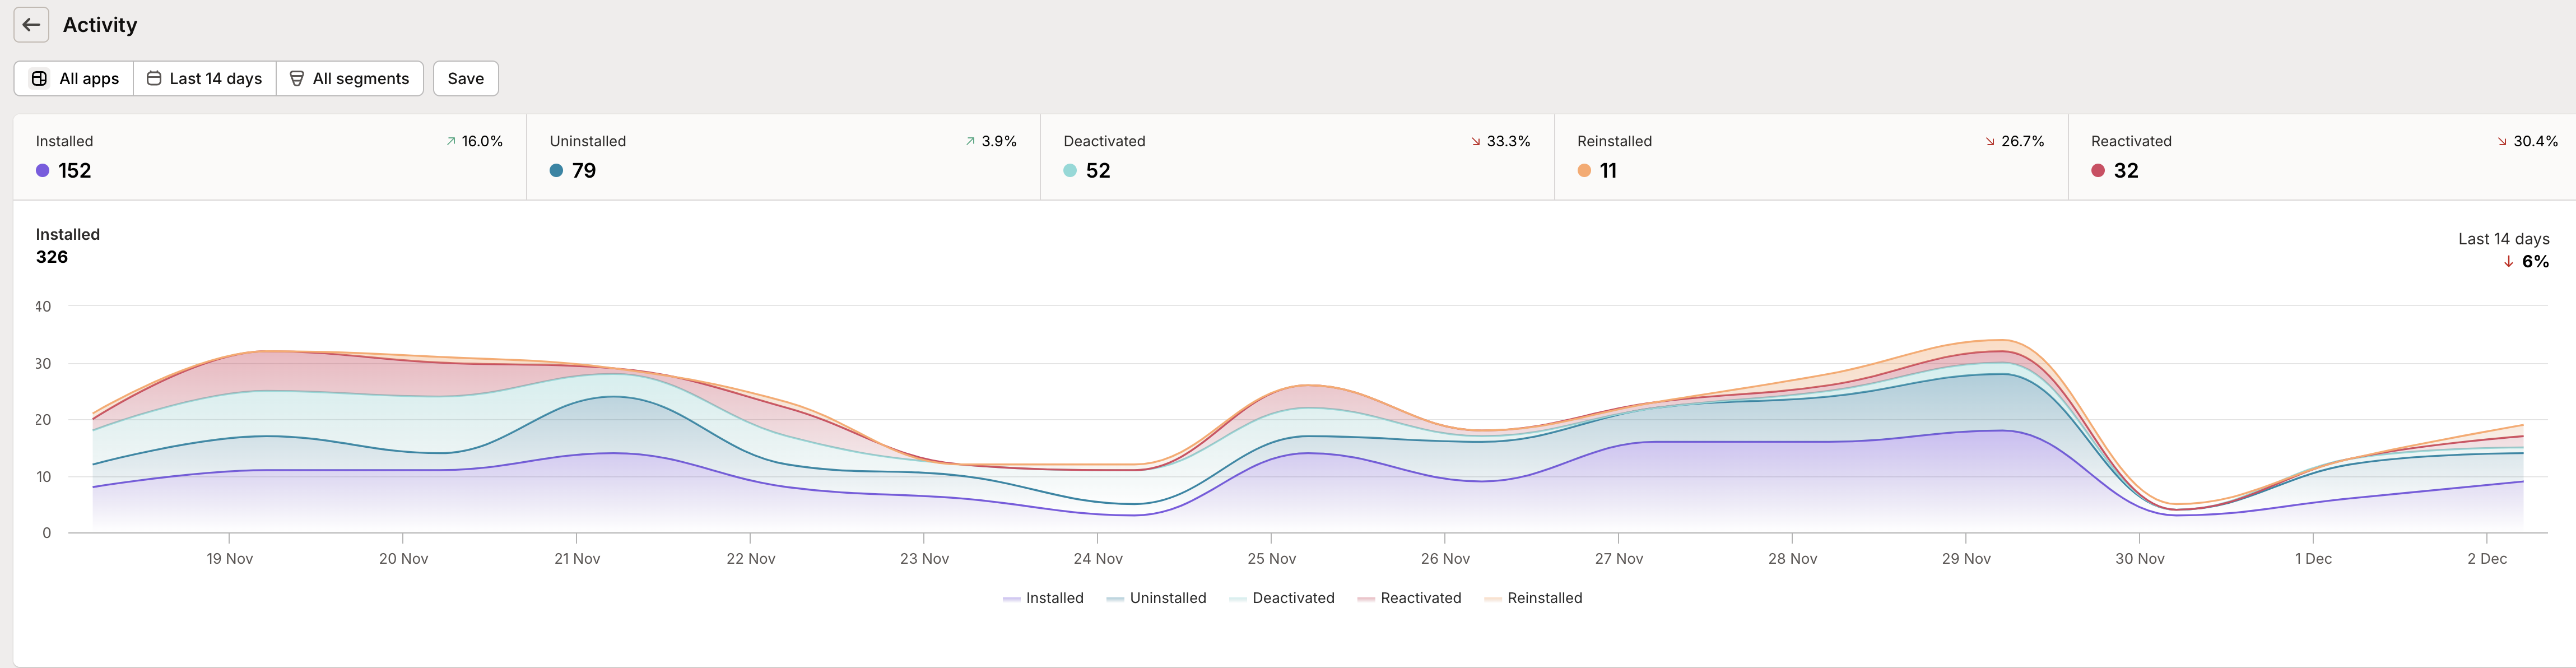
Right at the top, you’ll see five key metrics that tell the story of your app’s movement:
Installed: Brand new customers giving your app a try. These are merchants who’ve never installed your app before - fresh faces in your user base.
Uninstalled: Customers who’ve removed your app. Don’t worry too much about individual uninstalls, but watch for patterns that might signal larger issues.
Deactivated: Shops that have been frozen by Shopify or closed by the merchant. This one’s usually out of your control, but it’s important to understand how it affects your numbers.
Reinstalled: The comeback stories - customers who uninstalled but decided to give your app another shot. These are particularly interesting because they often signal improvements in your product or marketing.
Reactivated: Shops that were previously frozen but are now back in business. Keep an eye on these - they might need a little extra attention to get back up to speed.
Each metric shows a percentage change from the previous period, helping you quickly spot trends in any direction.
Interactive visualization
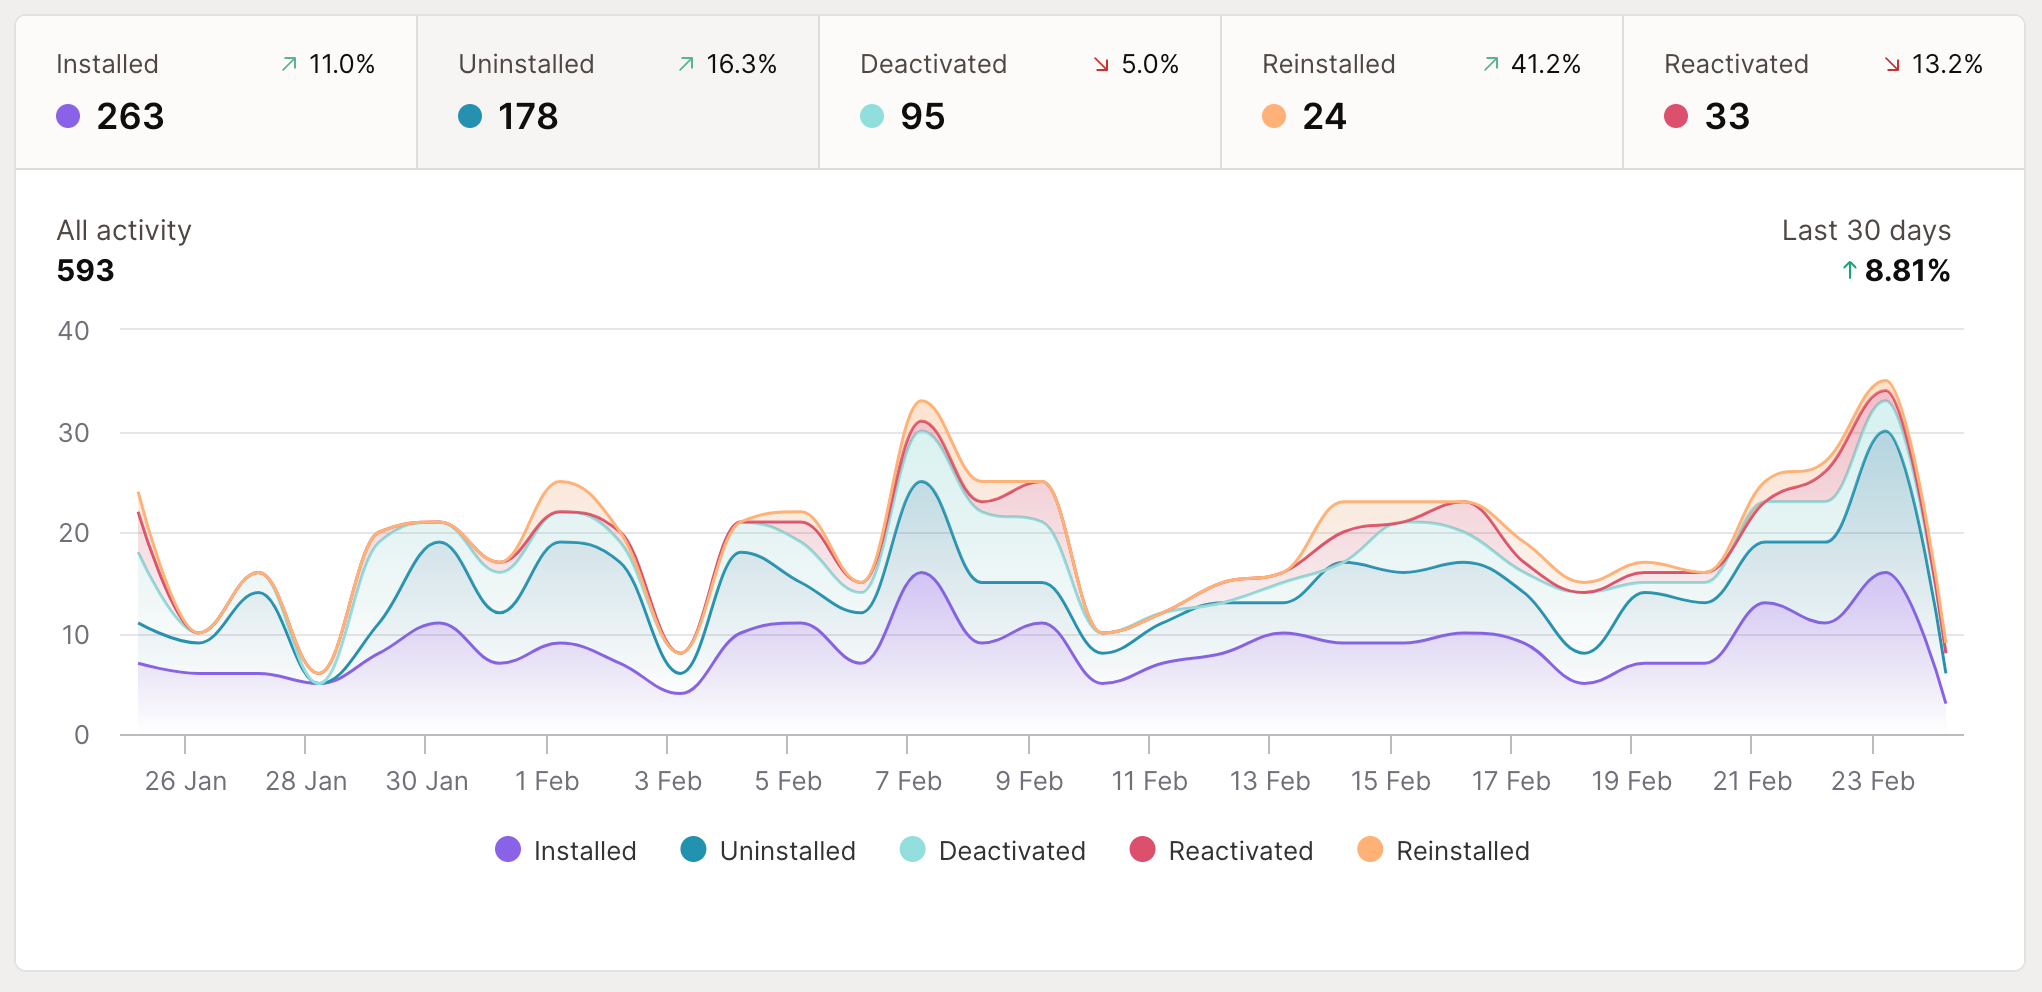
The main chart brings these metrics to life in two powerful ways:
Stacked View: When no metric is selected, you’ll see all activities stacked together, showing how different types of movement contribute to your overall activity levels.
Focused Analysis: Click any metric to isolate it, making it easier to spot patterns or investigate specific trends. Perfect for when you need to dig into why installations spiked last Tuesday or understand your typical uninstall patterns.
Active users tracking
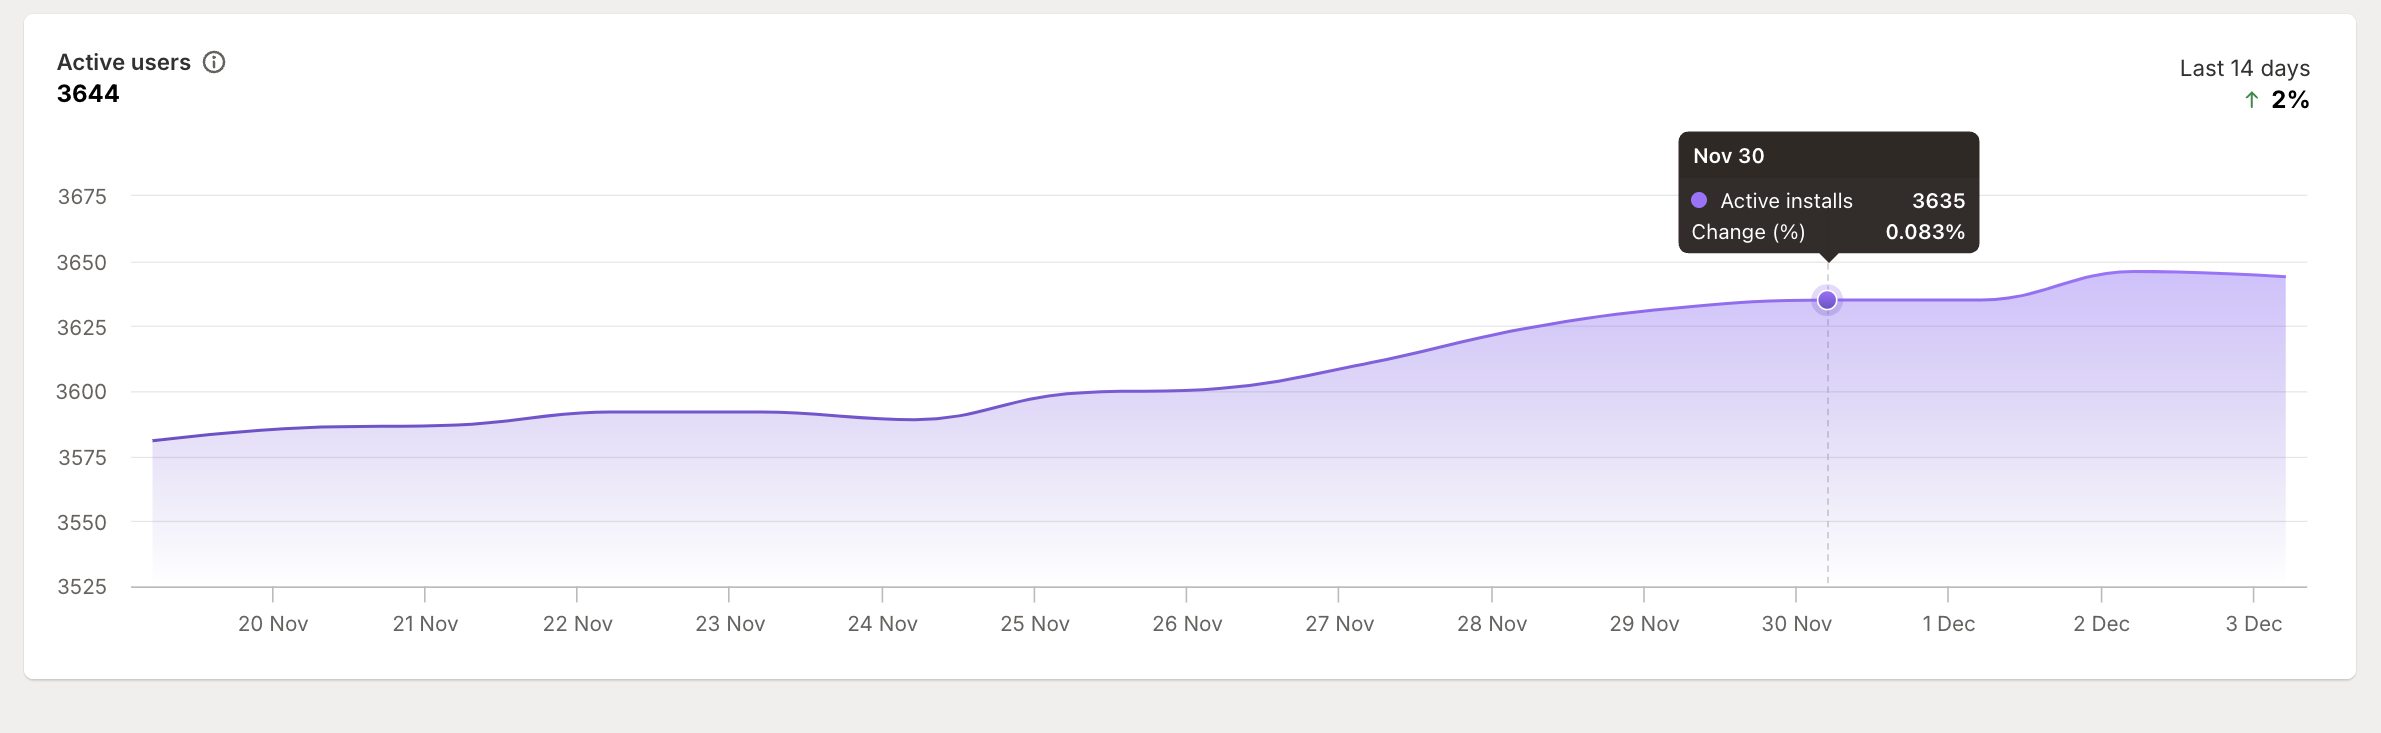
Below the activity chart, you’ll find your active user count. This isn’t just installed users - it’s specifically shops that have your app installed AND are actively running on Shopify. Why the distinction? Because an installed but frozen shop isn’t really a potential customer until they reactivate.
Understanding your numbers
How “active users” is calculated
Active users represents shops that have your app installed AND are currently able to use it. This means:
Shops with your app installed
Minus any shops that are frozen or closed
Gives you the true count of shops you can engage with
Frozen or closed shops can’t use your app until they reactivate, so we don’t count them as “active” even though your app is technically still installed.
Understanding different event types
Installed vs Reinstalled
Installed: Brand new customers who’ve never used your app before
Reinstalled: Previous customers giving your app another try after uninstalling
Deactivated vs Uninstalled
Uninstalled: Merchant actively chose to remove your app
Deactivated: Shop was frozen/closed (merchant didn’t choose this)
Why this distinction matters: Deactivated shops often reactivate later and become customers again, while uninstalls typically indicate a deliberate decision to stop using your app.
Movement patterns
Different types of movement tell different stories:
High reinstall rates might mean your app has strong product-market fit but needs work on initial onboarding
Increasing uninstalls could signal user experience issues or new competition
Lots of reactivations might mean it’s time to build a “welcome back” campaign
Making the most of this report
Strategic planning
Use activity data to inform key decisions:
Track installation trends to measure marketing effectiveness
Monitor uninstall patterns to spot potential product issues early
Watch reactivation rates to identify re-engagement opportunities
Use segmentation to understand how different types of customers behave
Pro tips
Get more value from your activity tracking:
Regular Check-ins
Make this part of your weekly routine
Look for patterns in day-of-week or time-of-month activity
Compare current trends against historical patterns
Smart Segmentation
Break down activity by store plan to understand your market
Track geographical segments to inform regional strategies
Monitor how different customer types respond to app updates
Trend Analysis
Use the period comparison to spot seasonal patterns
Watch for unexpected changes that might need investigation
Look for relationships between different types of activity
Remember: Every merchant who has your app installed, even if they’re not subscribed, is closer to becoming a paying customer than those who’ve never tried it. Understanding your activity patterns helps you focus your efforts where they’ll have the biggest impact.