

Revenue retention cohorts
Getting customers is one thing - keeping their revenue is another. Revenue Retention Cohorts shows you exactly how much value you retain from each group of customers over time, helping you spot patterns in both revenue stability and growth opportunities. This goes beyond simple customer counts to show you the true financial impact of your retention efforts.
What makes this report different
Most retention metrics focus on how many customers stick around. The Retention Cohorts report takes it further by tracking the actual money retained from each group of paying customers over time. Even better, it can show retention rates above 100% when customers grow their usage or upgrade their plans - giving you clear signals about which cohorts are your best opportunities for expansion.
Report components
The revenue picture
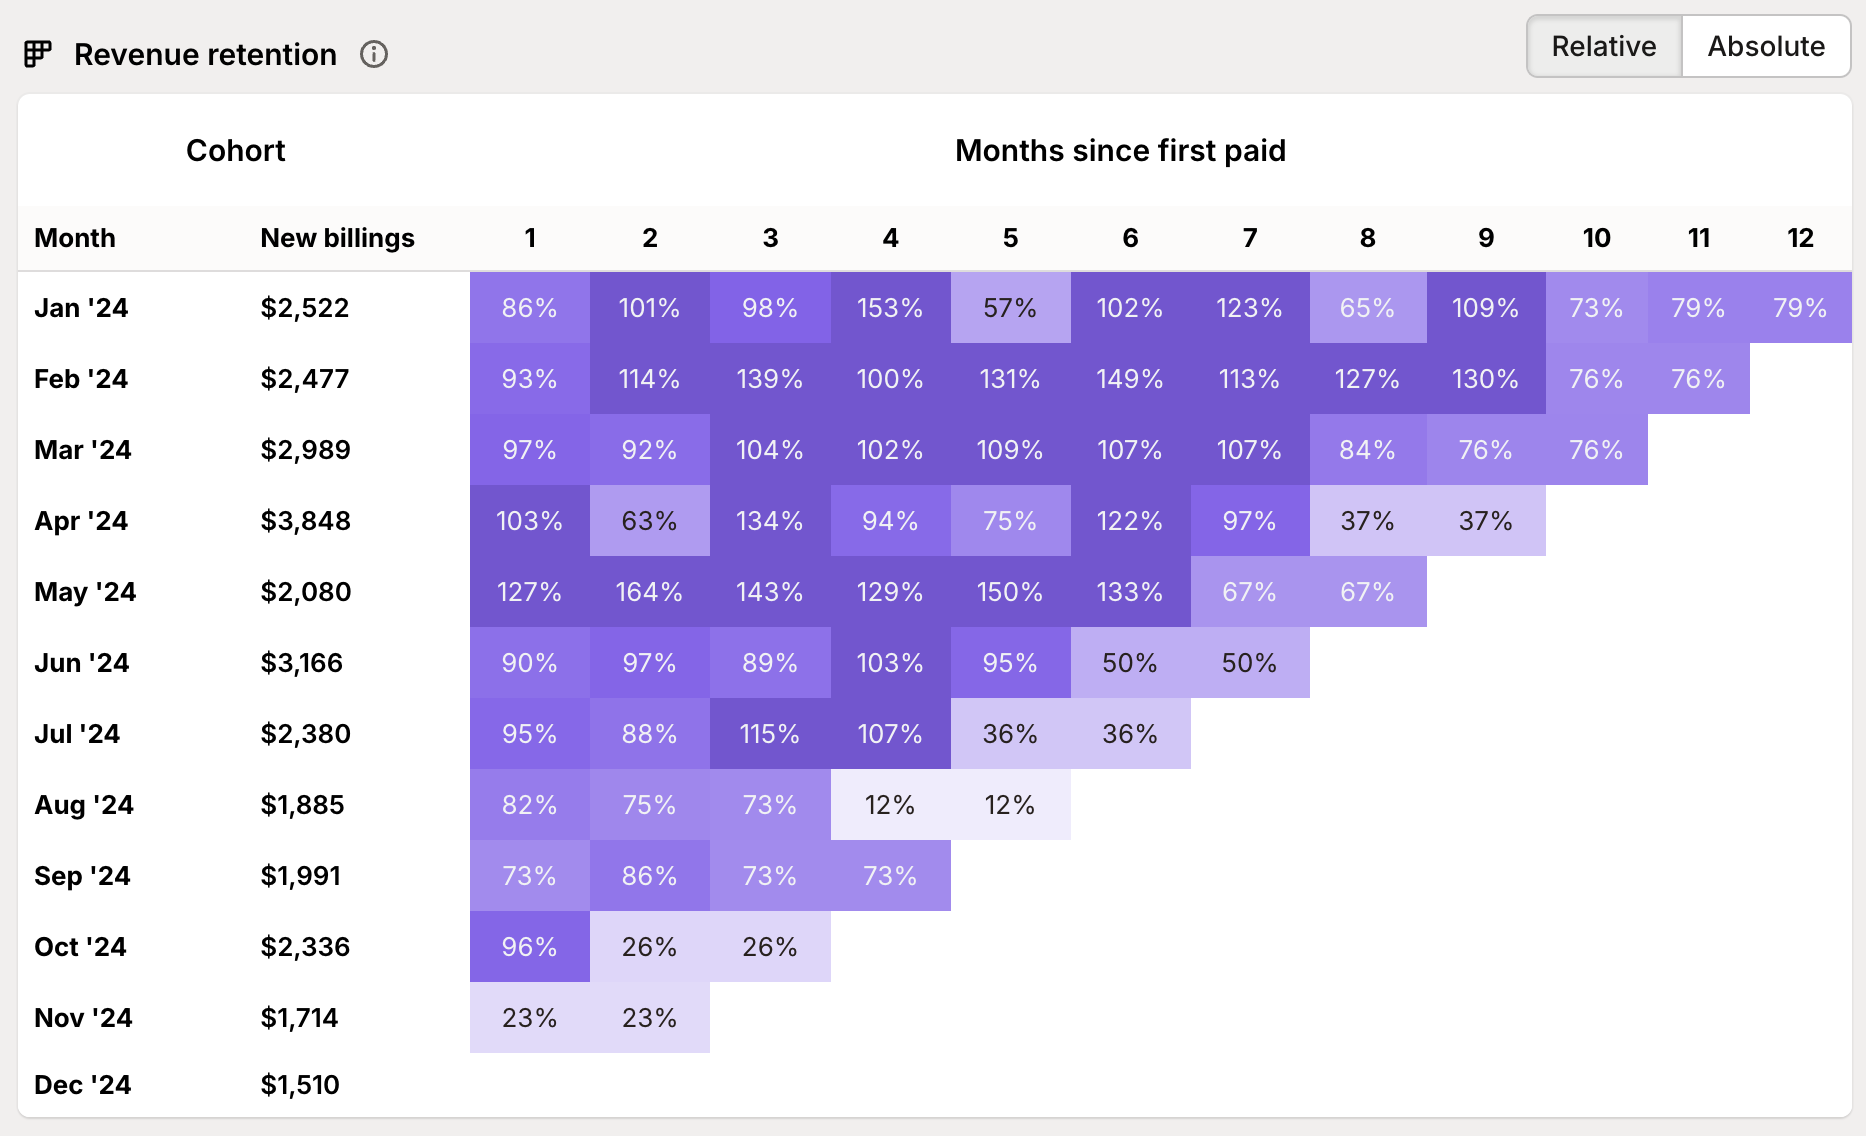
The main visualization breaks down your revenue retention by customer cohort:
New billings: Shows the initial revenue from each monthly cohort of new paying customers. This is your baseline for measuring future retention.
Monthly tracking: See exactly what percentage of that initial revenue stays (or grows) month after month.
Complete timeline: Track retention from month 1 all the way through month 12, revealing both short-term and long-term patterns in customer value.
Two powerful views
Toggle between two perspectives to understand your retention story:
Relative view: Shows percentages of initial revenue retained, making it easy to compare cohort performance regardless of size.
Absolute view: Displays actual dollar amounts, helping you understand the real financial impact of retention patterns.
Understanding your numbers
Timing and tracking
The report builds cohorts based on when customers make their first payment, not when they install or start trials. This means:
Cohorts reflect real revenue generation, not just engagement
First payments might represent partial months due to Shopify billing cycles
Month 1 shows the first full month of revenue, which can sometimes exceed the initial amount
Each subsequent month tracks revenue relative to the starting point
Reading the patterns
Your retention data tells multiple stories:
Growth signals
Retention rates above 100% show cohorts generating more revenue than they started with
Usually indicates successful upgrades or increased usage
Points to opportunities for expanding similar customer segments
Stability indicators
Steady retention rates across multiple months suggest stable, predictable revenue
Helps identify which types of customers tend to maintain their value longest
Reveals seasonal patterns that affect revenue stability
Warning signs
Sharp drops in retention might signal product issues or competitive pressures
Gradual declines could suggest pricing misalignment or feature gaps
Patterns affecting specific cohorts help isolate potential problems
Recovery patterns
Upward movements in later months often indicate successful reactivations
Can show the impact of win-back campaigns or seasonal returns
Help measure the effectiveness of customer recovery efforts
Making the most of this report
Smart analysis
Get more value from your retention data:
Compare cohort performance
Look for months or seasons that produce stronger retention
Identify acquisition channels that bring more stable revenue
Track how product changes affect newer cohorts
Investigate patterns
Dig into cohorts with unusually high or low retention
Look for common characteristics in stable cohorts
Connect retention changes to specific business initiatives
Plan for growth
Use historical patterns to forecast revenue stability
Identify optimal times for expansion initiatives
Guide customer success efforts toward proven retention patterns
Pro tips
Level up your retention analysis:
Smart filtering
Use segments to analyze retention across different customer types
Compare retention between billing providers if you use multiple systems
Focus on specific time periods to measure initiative impact
Pattern recognition
Watch how newer cohorts perform compared to historical patterns
Track the impact of product changes on retention curves
Use absolute numbers to weigh the importance of percentage changes
Action planning
Focus expansion efforts on cohorts showing growth potential
Plan interventions before historical drop-off points
Time retention initiatives around seasonal patterns
Remember: Revenue retention tells you more than just whether customers stay - it shows you how their value evolves over time. Use these insights to focus your retention efforts where they’ll have the biggest financial impact.
Need help making sense of your retention patterns or building strategies for revenue growth? Our team is here to help you turn these insights into action.