

Traffic sources
Before you start
For traffic source data to appear correctly, make sure you have completed the following:
GA4 + BigQuery integration — Your Google Analytics 4 must be connected to BigQuery, and BigQuery must be connected to Mantle. Set up GA4 and BigQuery →
App Store slug configured — Your app's App Store slug must be set in Mantle. Go to Your App → Settings and ensure the app store slug field matches the last part of your Shopify App Store URL (e.g.,
your-app-namefromapps.shopify.com/your-app-name).Google Cloud account is active — Your Google Cloud billing account must be active. If your GCP account is suspended or inactive, BigQuery will stop streaming data.
Data starts from connection date — Traffic source data is only available from the date you connected BigQuery. Google does not backfill historical data.
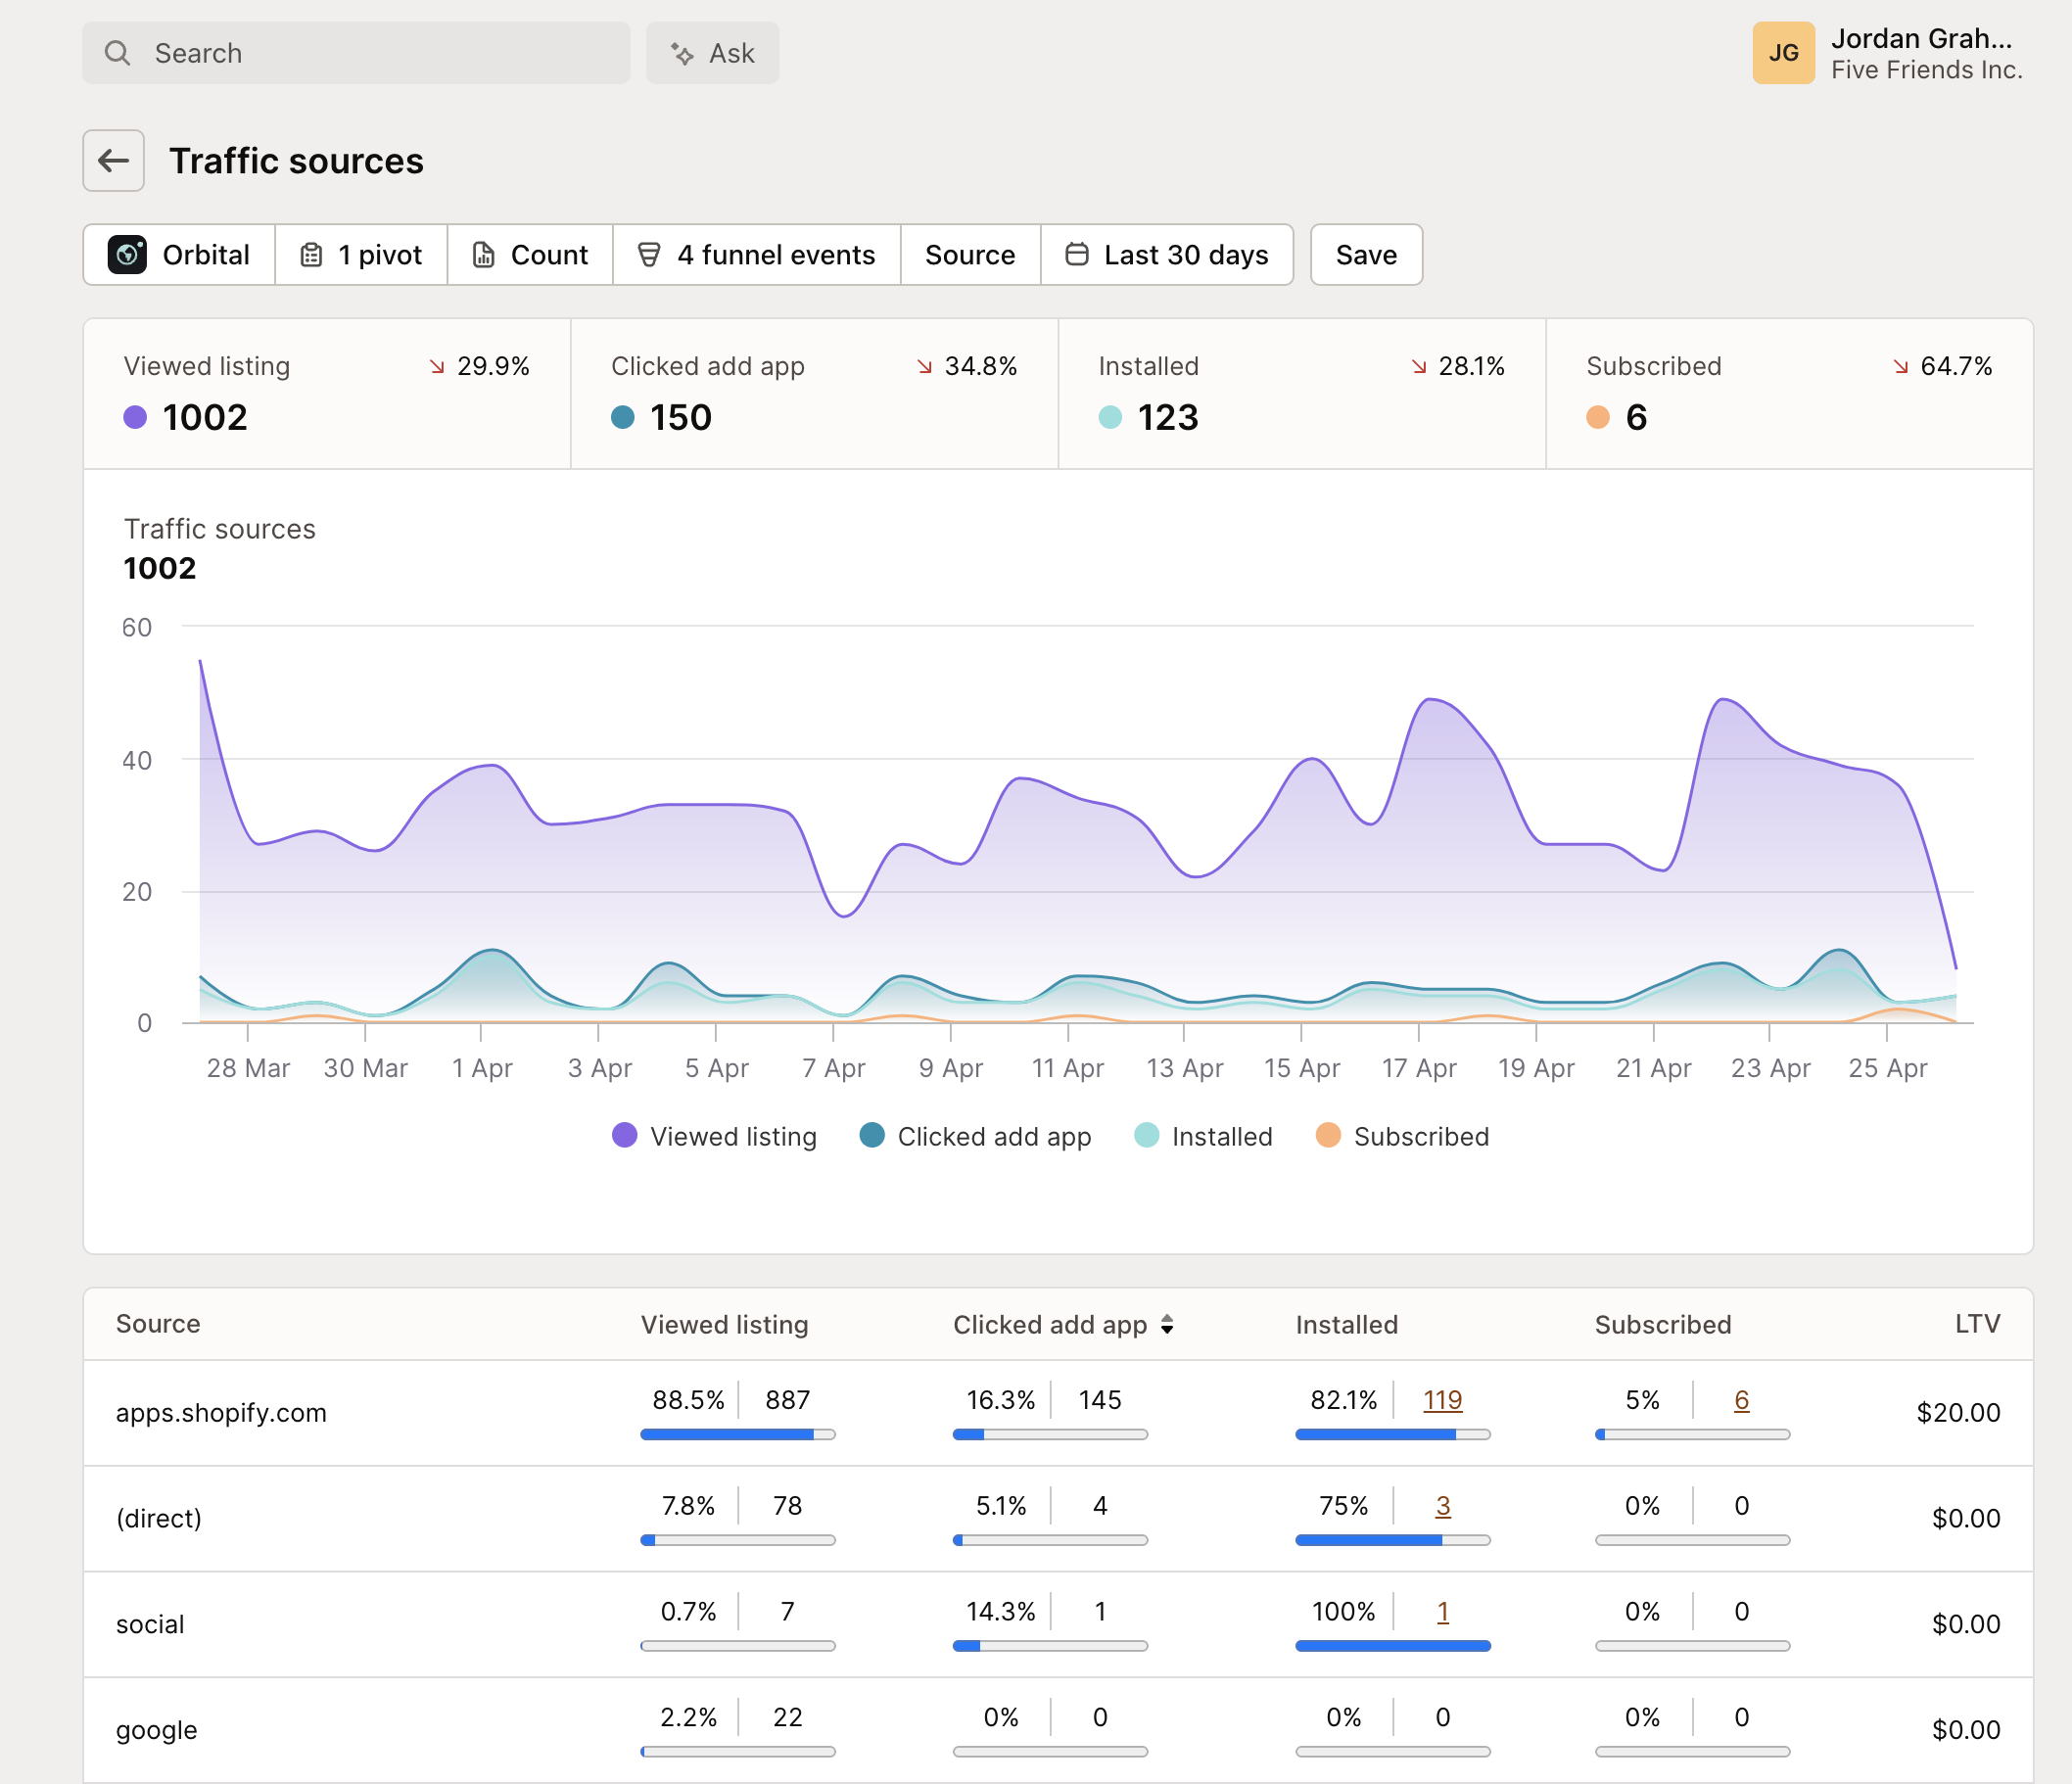
The Traffic Sources report reveals the complete story of your customer acquisition - tracking merchants from their first interaction with your App Store listing through to becoming a paid subscriber. By connecting pre-install behavior with conversion data, you can identify exactly which channels bring your most valuable customers.
Traffic source data syncs automatically with your App Store listing, giving you a complete picture of your acquisition funnel. More than just visitor analytics, Mantle helps you turn traffic insights into actionable marketing strategies across your entire business.
Understanding your sources
Shopify URL parameters
After you've set up analytics for your app listing, Shopify passes additional URL parameters when a merchant clicks on your app listing from the Shopify App Store. These parameters provide detailed information about how merchants found your app, including:
The language selected by the merchant
The type of page they came from (home, search, category, etc.)
The specific section of the page where they found your app
The exact position of your app within that section
These parameters give you valuable insights into your app's visibility and discoverability in the Shopify App Store.
For a complete reference of all URL parameters and their possible values, see the official Shopify documentation on tracking listing traffic.
Campaign tracking: In addition to these automatic Shopify parameters, you can add UTM parameters to any external links pointing to your app listing (ads, social media, emails) to track your marketing campaigns in this report.
Traffic dimensions
Each dimension reveals different aspects of your acquisition:
Source | Description |
|---|---|
apps.shopify.com | App Store traffic |
google.com | Search engine traffic |
facebook.com | Social media traffic |
yourwebsite.com | Direct site traffic |
(direct) | Untracked visits where Google Analytics couldn't detect a specific referrer or UTM tag |
Source medium | Description |
|---|---|
organic | Natural search and App Store browsing |
cpc | Paid advertising clicks |
referral | Website link traffic |
cpa | Cost-per-action campaigns |
Additional dimensions: You can also pivot by Search terms, Referrer sites, Campaign names, Surface types (search, category, collection), Surface details (Staff Picks, Trending), Surface positions, Language, Country, and Affiliate.
Understanding (direct) traffic
When you see (direct) as a traffic source, it means Google Analytics couldn't detect a specific referrer or UTM tag for that visit. This usually happens when visitors type your app's URL directly, use bookmarks, click untracked email links, browse privately, or arrive from sites that strip referrer information.
Performance metrics
Metric | Description |
|---|---|
Listing view volumes | How many merchants discover your app through this source |
Install click rates | The percentage of viewers who click to install from this source |
Installation completion | How many merchants actually finish the installation process |
Subscription conversion | The number of installations that turn into paying subscriptions |
Source-specific LTV | The average lifetime value of customers from each source |
MRR | Monthly recurring revenue metrics showing active MRR / total MRR generated from each source |
Available funnel events
The Traffic Sources report tracks customer journey events from discovery to revenue. Available events depend on your integrations:
Pre-Install Events
Require Google Analytics 4 with BigQuery integration
Event | Description |
|---|---|
App Listing Page View | Customer views your app's listing page |
Add App Button Clicked | Customer clicks "Add app" button |
Post-Install Events
Available to all customers
Installation & Setup
Event | Description |
|---|---|
Installed | Customer installs your app |
Reinstalled | Customer reinstalls your app after previously uninstalling |
Uninstalled | Customer removes your app from their store |
Trial & Conversion
Event | Description |
|---|---|
Trial Started | Customer begins free trial (trial apps only) |
Trial Converted | Trial customer becomes paying subscriber |
Subscription Management
Event | Description |
|---|---|
Subscribed | Customer activates a paid subscription |
Unsubscribed | Customer cancels their subscription |
Resubscribed | Previously cancelled customer reactivates their subscription |
Upgraded | Customer moves to a higher-tier plan |
Downgraded | Customer moves to a lower-tier plan |
Subscription Frozen | Customer's subscription is temporarily paused |
Subscription Unfrozen | Customer's subscription is reactivated after being frozen |
Revenue Events
Event | Description |
|---|---|
One-time Charge | Customer makes a one-time purchase |
First Transaction | Customer completes their first revenue-generating transaction |
Charge Abandoned | Customer starts but doesn't complete a billing process |
Account Management
Event | Description |
|---|---|
Customer Account Reactivated | Previously inactive customer becomes active again |
Customer Account Deactivated | Active customer account becomes inactive |
Event selection tips
Choose from the funnel events dropdown to add events to your chart
Events automatically appear based on your app configuration (e.g., trial events only show for trial-enabled apps)
This report requires Google Analytics 4 + BigQuery integration to function
Use "Change event order" to reorder events in your funnel
Recommended order for apps with trials:
Installed → Trial Started → Subscribed → Trial Converted
Using the report
Filtering and pivots
The report offers powerful filtering and pivot capabilities including 11 pivot dimensions (Source, Source medium, Search term, Affiliate, Referrer site, Campaign, Surface type, Surface detail, and more) and 22 funnel events to track along the customer journey.
Key insights
The breakdown table shows:
Source-specific conversion rates - see how many visitors from each source become paying customers
Full funnel progression - watch how visitors move from discovery to subscription
LTV by traffic source - understand which channels bring your highest-value customers
Revenue attribution - identify which sources generate the most revenue (active MRR / total MRR)
Customer details - click through to see actual customers and their complete journey
Common use cases
Teams use this report to compare channel quality, identify high-LTV sources, optimize campaigns, improve App Store listing performance, and prioritize partnerships. You can analyze search terms to understand merchant discovery patterns, identify which referrer sites send best-converting visitors, and track performance across different App Store sections.
Go further
Ready to take your traffic analysis to the next level? Our comprehensive guide on mastering your traffic sources shows you how to move beyond basic reporting to double down on what drives real growth. Learn advanced techniques for LTV analysis, affiliate optimization, and strategic budget allocation.